Till now we have seen static structural analysis before. If you have not seen those posts, you can check them out here. In this post, we are going to add a bit of twist to it and perform transient structural Analysis.
So let’s start by understanding what Transient Analysis is and then we will proceed to perform the analysis.
What is Transient Analysis?
To understand what transient analysis is first we need to understand what we mean by transient and what is the difference between transient and steady.
Steady by definition is something that stays the same or constant with time whereas transient means the subject which is under consideration changes with time. For example, you must have heard steady and transient flow in fluids. This should not be confused with static and dynamic.
So what do we do in Transient Analysis?
In transient analysis, we apply a time-varying load on the subject or structure and observe the results. This type of analysis is closer to real-world scenarios where load keeps varying with time.
Performing Transient Analysis
For this tutorial, we will be using an I Beam with a thickness of 2 mm, fixing its side faces and applying load on its top face.
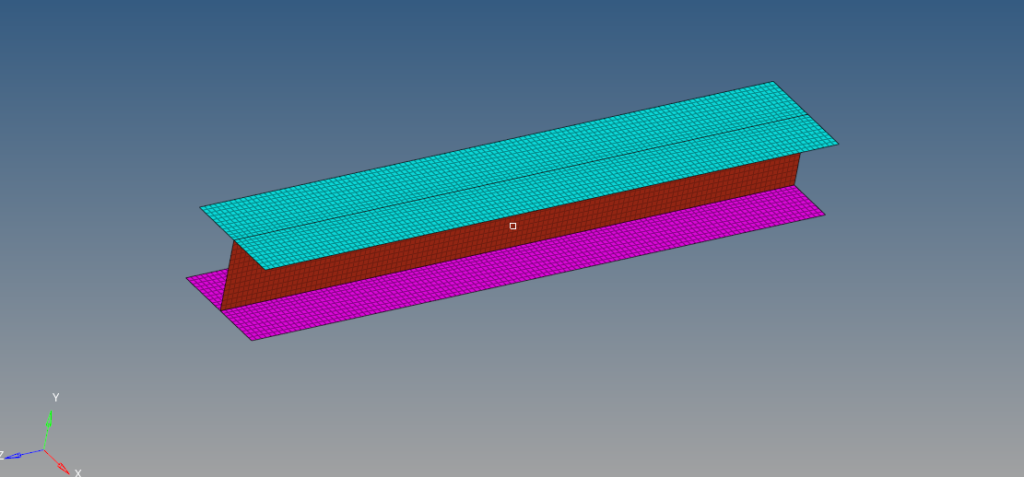
Meshed Model
For this tutorial, we will use an I Beam with a thickness of all its faces as 2mm. The model is meshed using Quad elements. The quad elements have been assigned a thickness of 2.
Boundary Condition
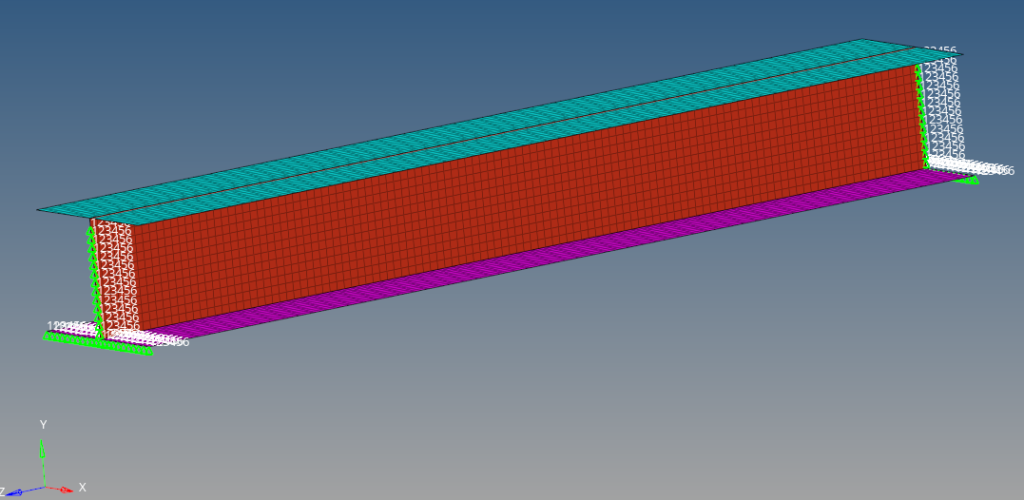
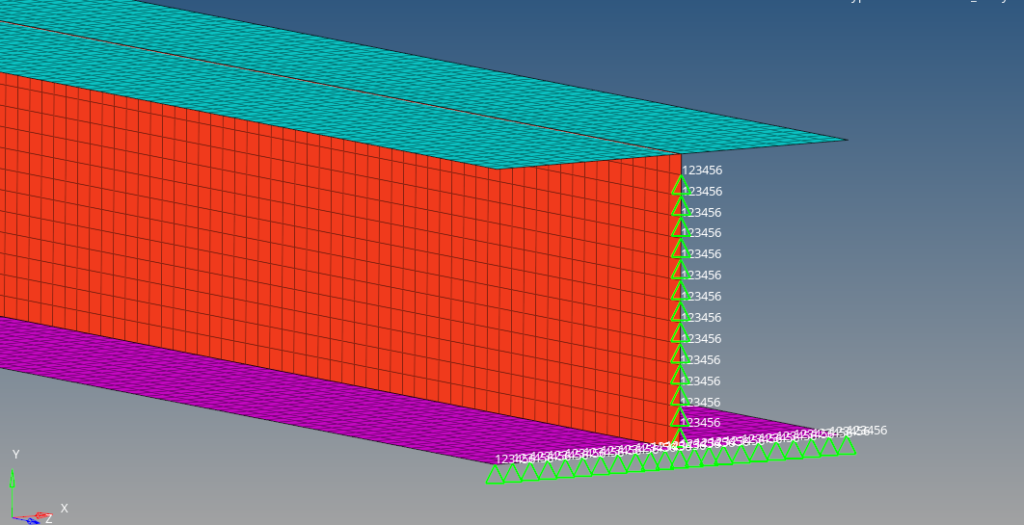
We will create a load collector named constraint to constrain the bracket. We can do this by right-clicking on the white-browser area and then going to Create -> Load Collectors. We will constrain all the degrees of freedom of the nodes on the I face of I Beam except the nodes on the top flange as shown in the image below.
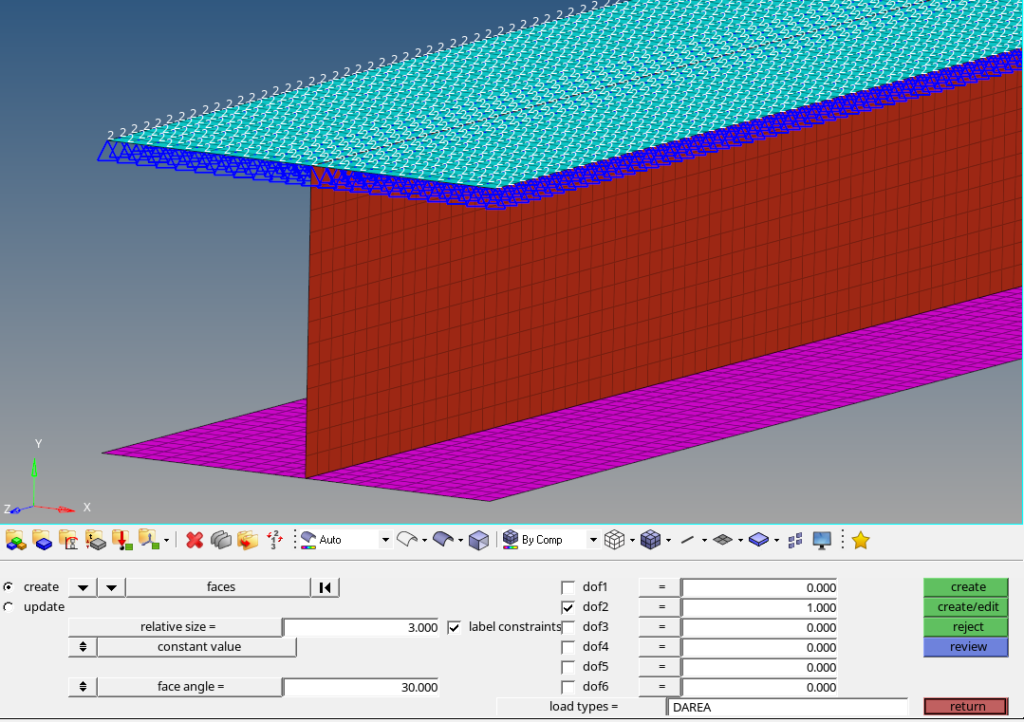
Next, we will create a load collector named DAREA. We can do this by right-clicking on the white-browser area and then going to Create -> Load Collectors. We need to go to Analysis -> Constraints and then select load type as DAREA and then uncheck all the degrees of freedom except dof2, this is because the load will be applied in the Y direction.
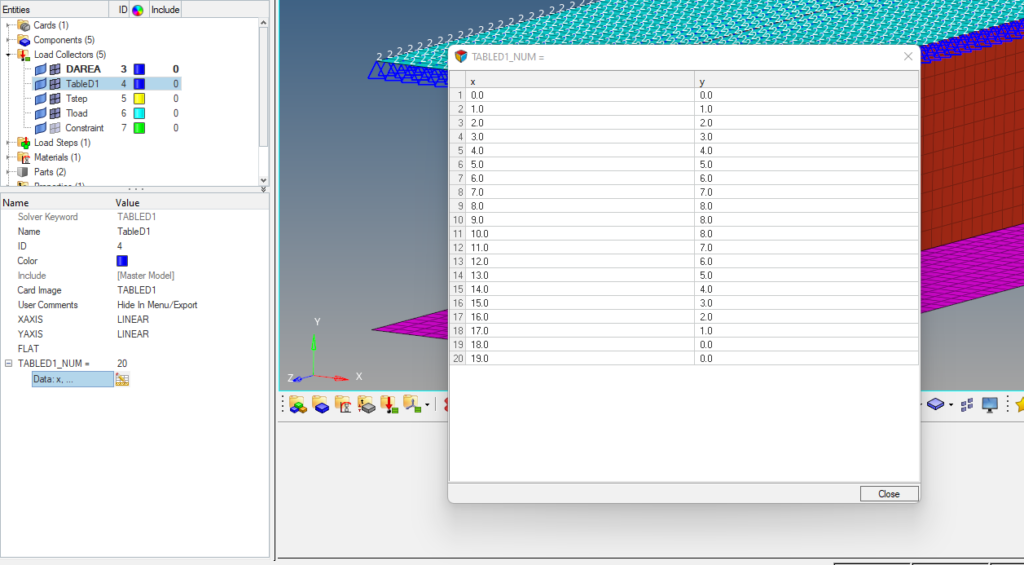
Next, we will create a TableD1 load collector named TableD1. We can do this by right-clicking on the white-browser area and then going to Create -> Load Collectors. We need to select the card image as TABLED1. We will put TableD1_Num as 20 as we will use 20 data points here. Then we need to fill in the data as shown in the image below.
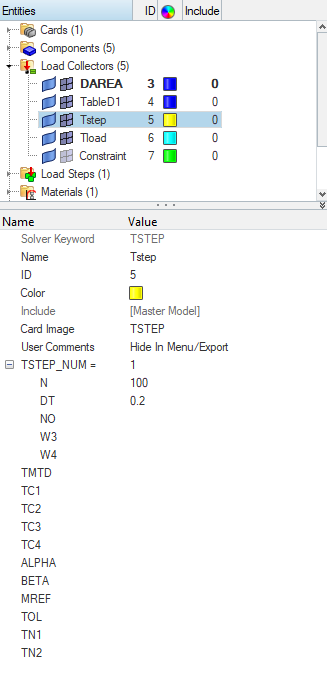
Next, we will create a TSTEP load collector named Tstep. We can do this by right-clicking on the white-browser area and then going to Create -> Load Collectors. We need to select the card image as TSTEP. We will put N as 100 and DT as 0.2.
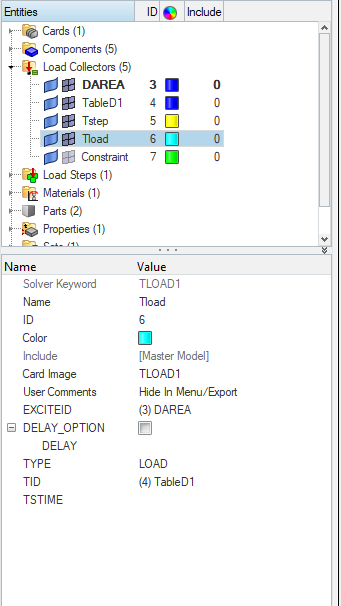
Next, we need to create a TLOAD1 load collector. We can do this by right-clicking on the white-browser area and then going to Create -> Load Collectors. We need to select the card image as TLOAD1. Select the DAREA load collector in the ExciteID field, Type as LOAD, and TableD1 load collector in the TID field.
Analysis Setup
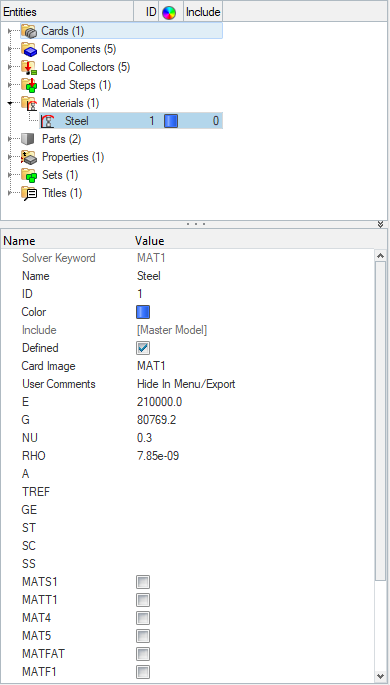
Now we will create material and property for the I beam. We will use steel material for the I beam.
We can create material by right-clicking on the white browser area and then going to Create -> Materials. We will name this material as Steel as shown in the images below.
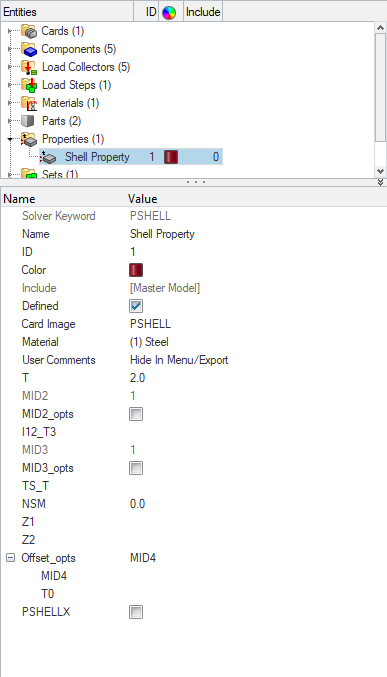
Next, we need to create a property for the beam. For this, we can again go to the white browser area and then right-click on the white browser area and then go to Create -> Properties. We will name this property as Shell_Property as shown in the image below.
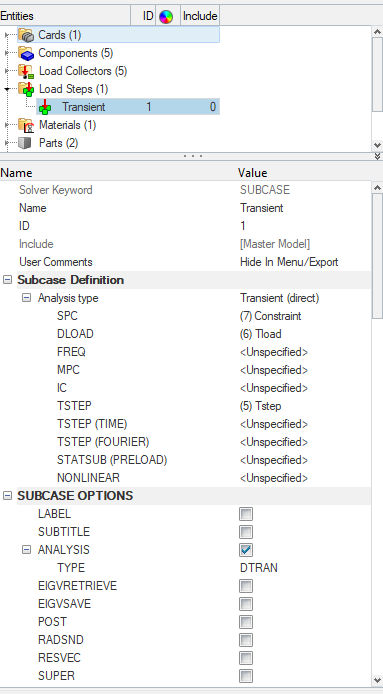
Next, we will assign these materials and properties to the respective components, create a load step for the analysis, name it Transient and select the analysis type as transient (direct), and reference the constraint under the SPC field, the Tload load collector under the DLOAD field, the Tstep load collector under the Tstep field as shown in the image below.
Select the Displacement and Stress output format as H3D and options as all.
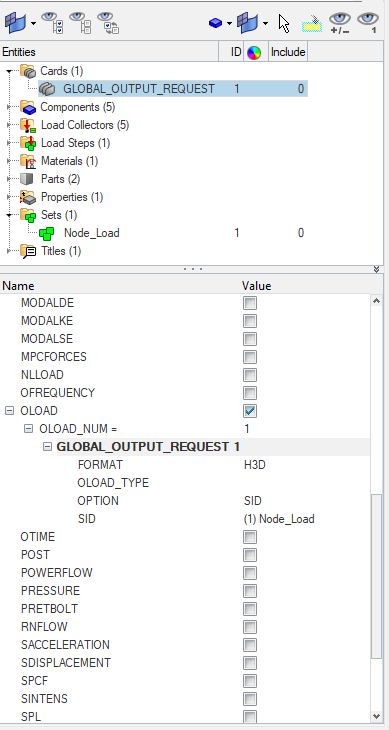
In addition to the above, we will also create a set for the nodes on the top flange of the I beam to view their graphical results. To view this result in the output we need to select OLOAD under the Global Output Request, we will keep the format of this as H3D, the option as SID, and select the set for the nodes of the top flange under the SID field as shown in the image below.
Performing Analysis
Now we have everything in place. We will perform the analysis. For this we can go to Analysis -> Optistruct select the run options as ‘Analysis’ and then click on Optistruct.
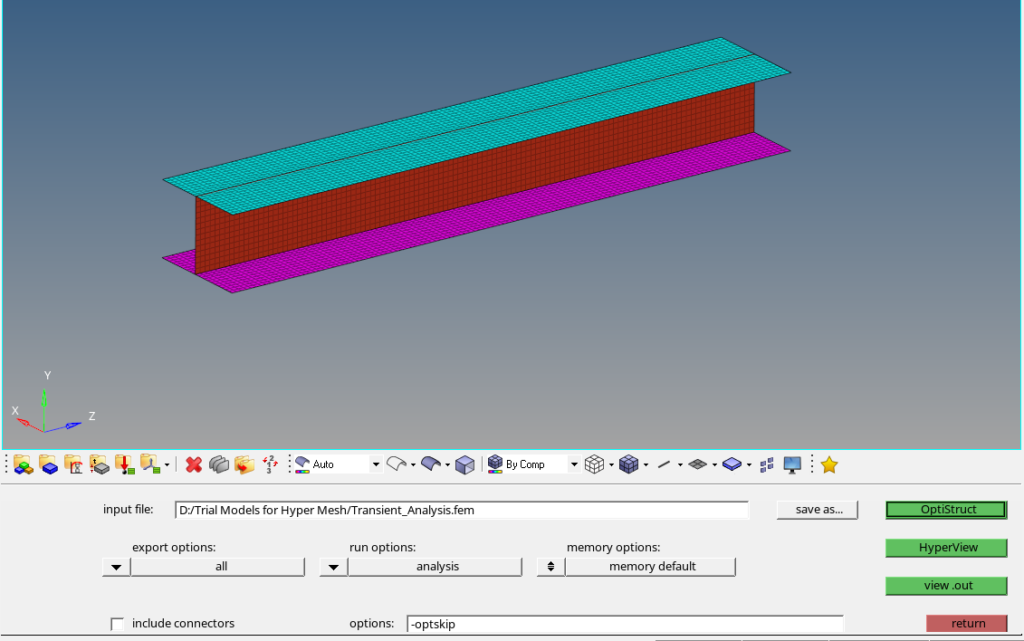
Output
After you click on Optistruct a pop-up window will appear showing the progress of the run.
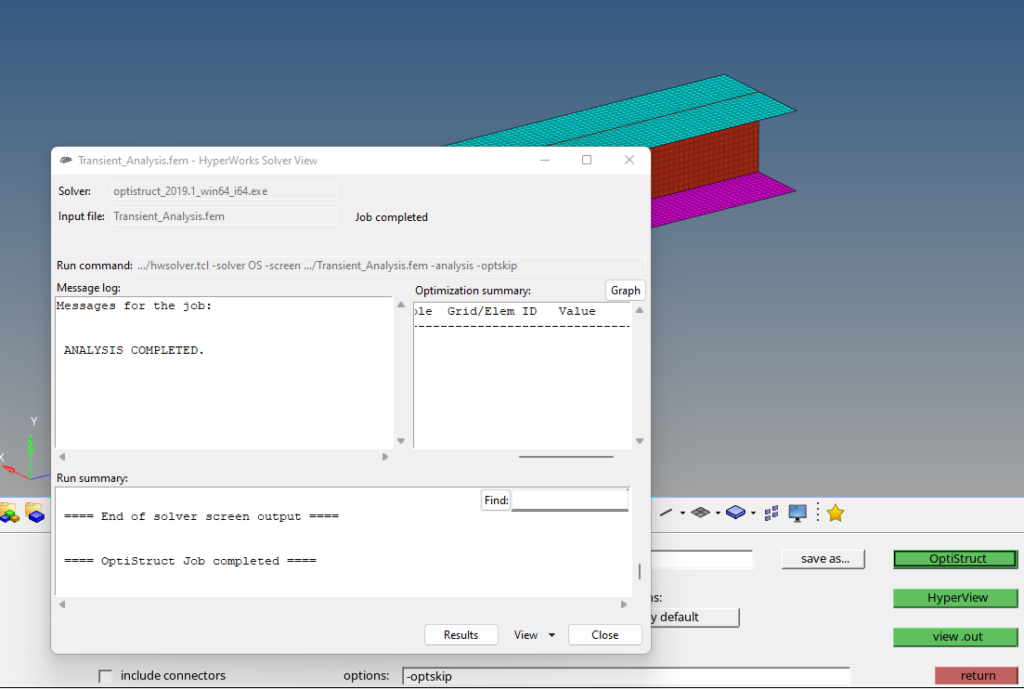
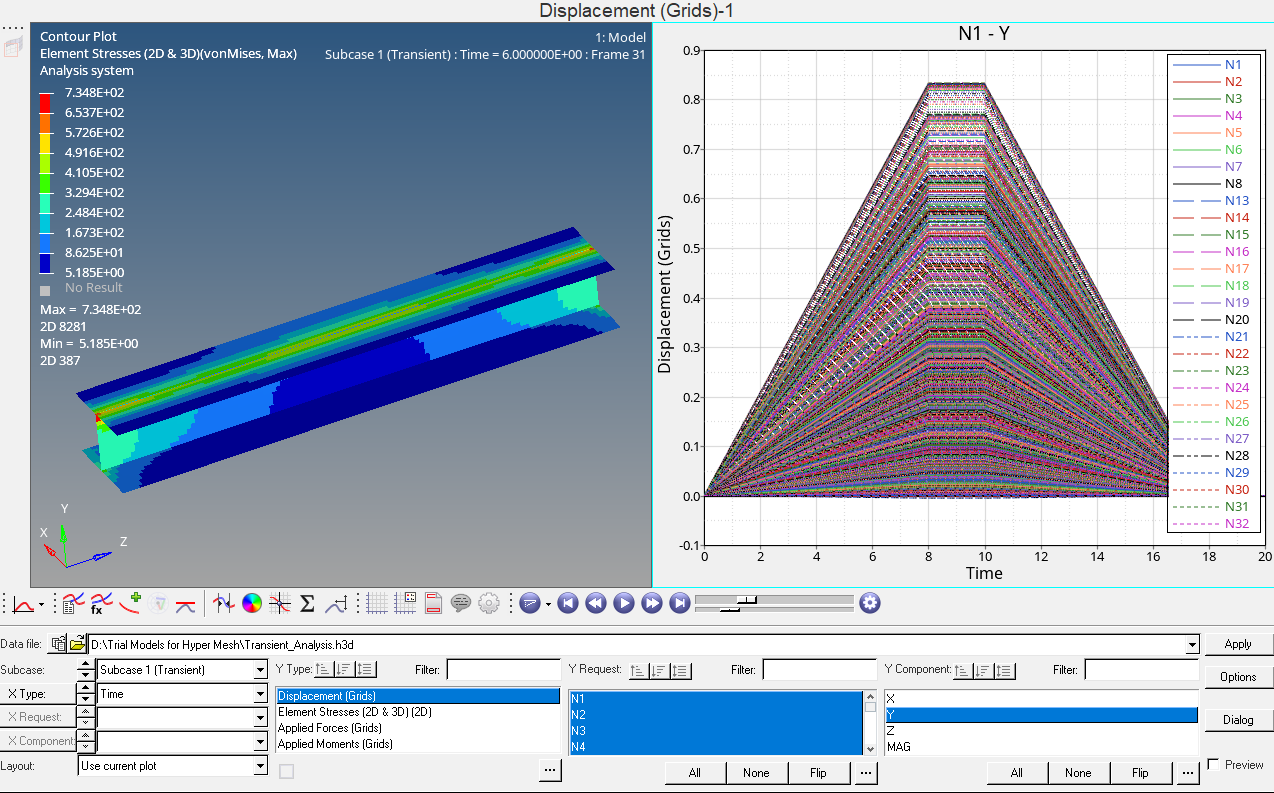
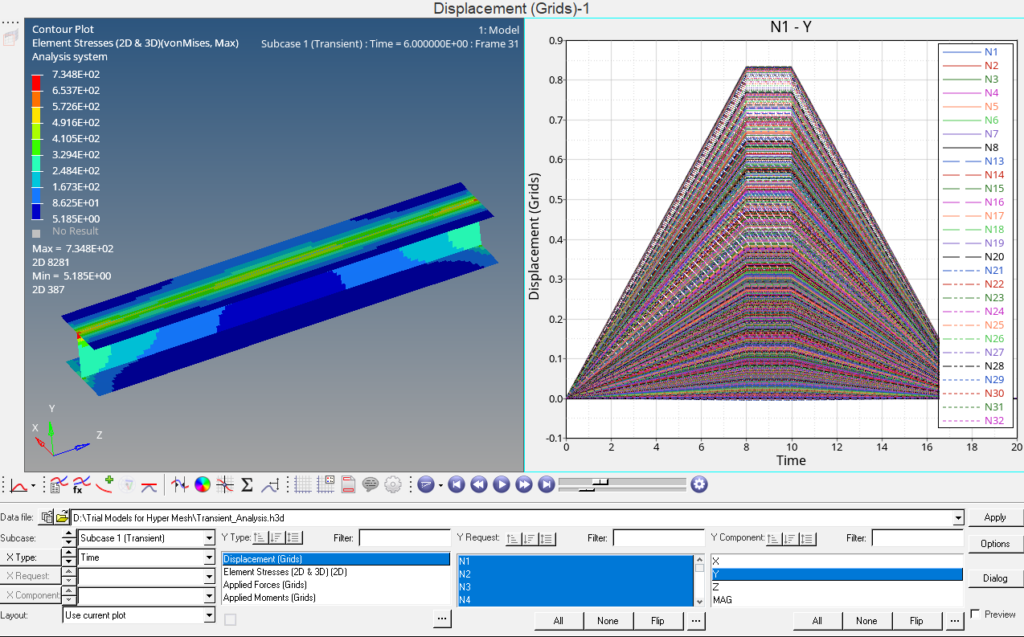
After the run is complete we can click on Results to view the results in Hyperview as shown in the image below.
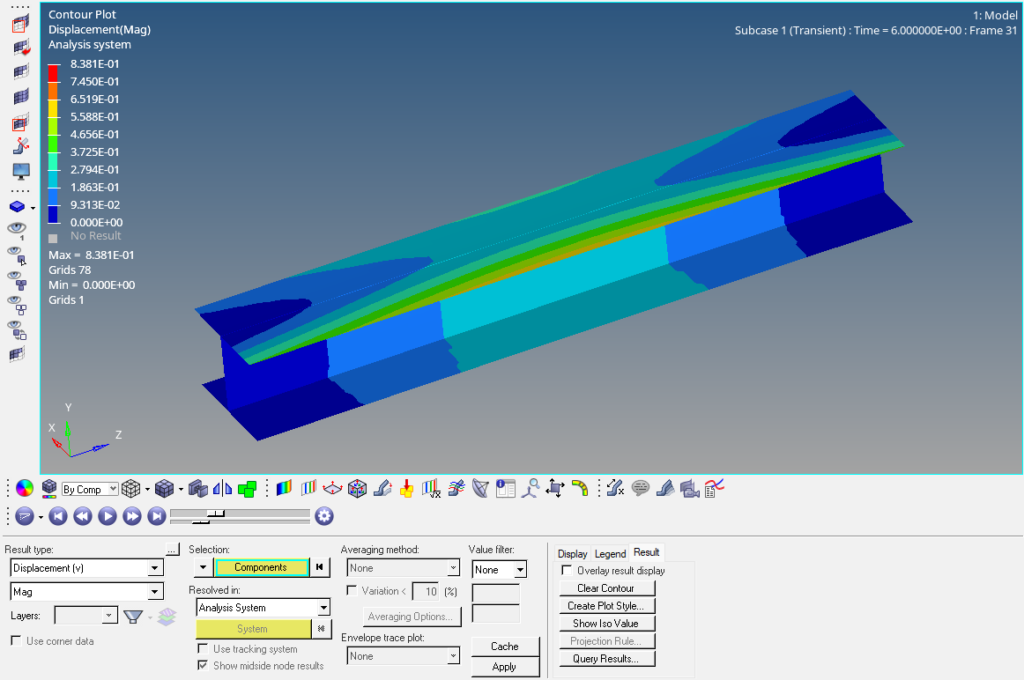
Displacement Results
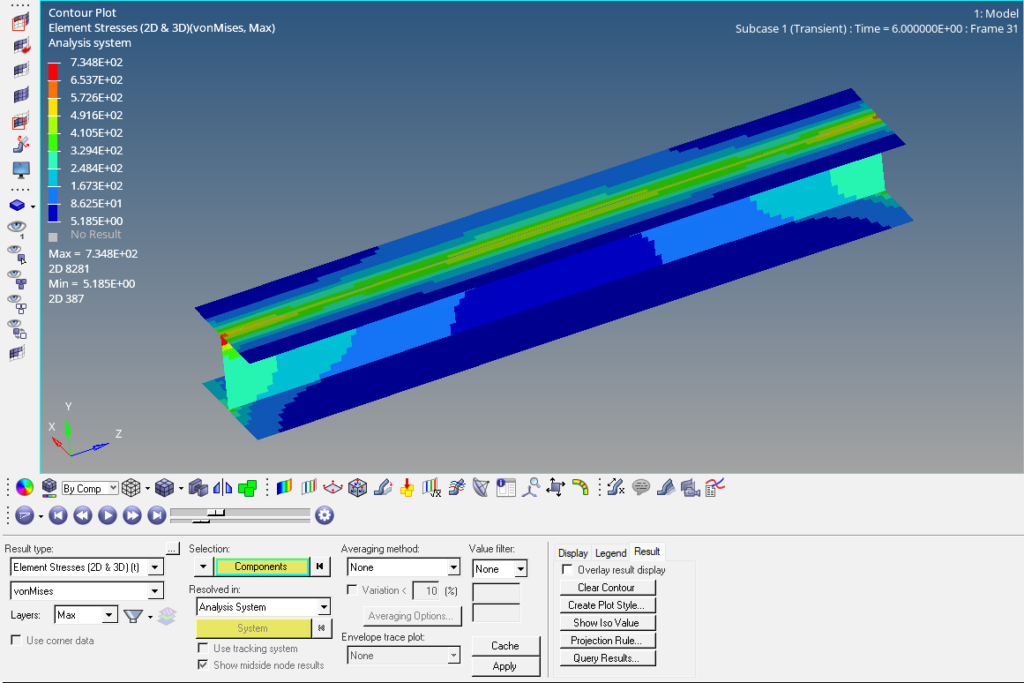
Stress Results
Refer to the video below for more clarity on the topic.
This is all for this post. I’ll see you all in the next post. Don’t forget to follow my Facebook and Instagram Pages for regular updates. Until then, keep learning.
